- 浏览: 4534257 次
- 性别:

- 来自: 济南
-

最新评论
-
wahahachuang8:
GoEasy 实时推送支持IE6-IE11及大多数主流浏览器的 ...
服务器推送技术 -
pdztop:
inffas32.asm(594) inffas32.asm( ...
zlib 在 Visual Studio 2005 下编译失败的解决办法 -
myangle89:
这个方法有效果,但还是绕了一大圈。另外:如果每次这样使用,会造 ...
利用 Spring 与 Log4J 巧妙地进行动态日志配置切换并立即生效 -
lsw521314:
亲,请把用到的包贴出来好么?这版本问题搞得我头大······· ...
lucene MMAnalyzer 实现中文分词 -
guji528:
多命令执行:cmd /k reg delete "H ...
REG Command in Windows XP - Windows XP REG命令的作用和用法
Read this article for a general overview of UML. First published in the June 2003 issue of The Rational Edge.
 Way back in the late twentieth century ?
1997 to be exact ?the Object Management Group (OMG) released the Unified Modeling Language (UML). One of the purposes of UML was to provide the development community with a stable and common design language that could be used to develop and build computer applications. UML brought forth a unified standard modeling notation that IT professionals had been wanting for years. Using UML, IT professionals could now read and disseminate system structure and design plans ?just as construction workers have been doing for years with blueprints of buildings.
It is now the twenty-first century ?2003 to be precise ?and UML has gained traction in our profession. On 75 percent of the resumes I see, there is a bullet point claiming knowledge of UML. However, after speaking with a majority of these job candidates, it becomes clear that they do not truly know UML. Typically, they are either using it as a buzz word, or they have had a sliver of exposure to UML. This lack of understanding inspired me to write this quick introduction to UML 1.4. When you are finished reading you will not have enough knowledge to put UML on your resume, but you will have a starting point for digging more deeply into the language.
A little background
As
I mentioned, UML was meant to be a unifying language enabling IT
professionals to model computer applications. The primary authors were
Jim Rumbaugh, Ivar Jacobson, and Grady Booch, who originally had their
own competing methods (OMT, OOSE, and Booch). Eventually, they joined
forces and brought about an open standard. (Sound familiar? A similar
phenomenon spawned J2EE, SOAP, and Linux.) One reason UML has become a standard
modeling
language is that it is programming-language independent. (UML modeling
tools from IBM Rational are used extensively in J2EE shops as well in
.NET shops.) Also, the UML notation set is a language and not a
methodology. This is important, because a language, as opposed to a
methodology, can easily fit into any companys way of conducting
business without requiring change.
Since UML is not a methodology, it does not require any formal work products (i.e., artifacts in IBM Rational Unified Process?/SUP> lingo). Yet it does provide several types of diagrams that, when used within a given methodology, increase the ease of understanding an application under development. There is more to UML than these diagrams, but for my purposes here, the diagrams offer a good introduction to the language and the principles behind its use. By placing standard UML diagrams in your methodologys work products, you make it easier for UML-proficient people to join your project and quickly become productive. The most useful, standard UML diagrams are: use case diagram, class diagram, sequence diagram, statechart diagram, activity diagram, component diagram, and deployment diagram.
It is beyond the scope of this introductory article to go into great detail about each type of diagram. Instead, I will provide you with enough information for a general understanding of each one and then supply more details in later articles.
Use-case diagram
A
use case illustrates a unit of functionality provided by the system.
The main purpose of the use-case diagram is to help development teams
visualize the functional requirements of a system, including the
relationship of actors (human beings who will interact with the system)
to essential processes, as well as the relationships among different
use cases. Use-case diagrams generally show groups of use cases ?either
all use cases for the complete system, or a breakout of a particular
group of use cases with related functionality (e.g., all security
administration-related use cases). To show a use case on a use-case
diagram, you draw an oval in the middle of the diagram and put the name
of the use case in the center of, or below, the oval. To draw an actor
(indicating a system user) on a use-case diagram, you draw a stick
person to the left or right of your diagram (and just in case youre
wondering, some people draw prettier stick people than others). Use
simple lines to depict relationships between actors and use cases, as
shown in Figure 1.
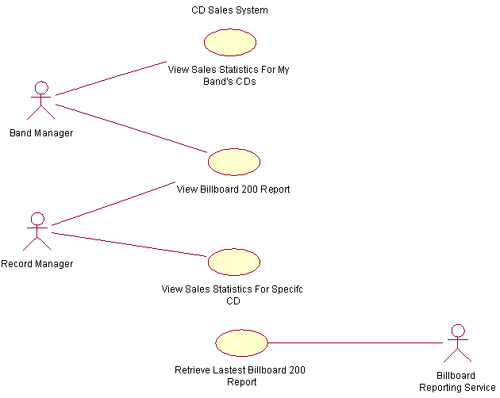 |
| Figure 1: Sample use-case diagram |
A use-case diagram is typically used to communicate the high-level functions of the system and the systems scope. By looking at our use-case diagram in Figure 1, you can easily tell the functions that our example system provides. This system lets the band manager view a sales statistics report and the Billboard 200 report for the bands CDs. It also lets the record manager view a sales statistics report and the Billboard 200 report for a particular CD. The diagram also tells us that our system delivers Billboard reports from an external system called Billboard Reporting Service.
In addition, the absence of use cases in this diagram shows what the system doesnt do. For example, it does not provide a way for a band manager to listen to songs from the different albums on the Billboard 200 ?i.e., we see no reference to a use case called Listen to Songs from Billboard 200. This absence is not a trivial matter. With clear and simple use-case descriptions provided on such a diagram, a project sponsor can easily see if needed functionality is present or not present in the system.
Class diagram
The
class diagram shows how the different entities (people, things, and
data) relate to each other; in other words, it shows the static
structures of the system. A class diagram can be used to display
logical classes, which are typically the kinds of things the business
people in an organization talk about ?rock bands, CDs, radio play; or
loans, home mortgages, car loans, and interest rates. Class diagrams
can also be used to show implementation classes, which are the things
that programmers typically deal with. An implementation class diagram
will probably show some of the same classes as the logical classes
diagram.The implementation class diagram wont be drawn with the same
attributes, however, because it will most likely have references to
things like Vectors and HashMaps.
A
class is depicted on the class diagram as a rectangle with three
horizontal sections, as shown in Figure 2. The upper section shows the
classs name; the middle section contains the classs attributes; and the
lower section contains the classs operations (or methods).
 |
| Figure 2: Sample class object in a class diagram |
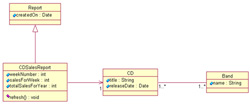
In my experience, almost every developer knows what this diagram is, yet I find that most programmers draw the relationship lines incorrectly. For a class diagram like the one in Figure 3,you should draw the inheritance relationship1 using a line with an arrowhead at the top pointing to the super class, and the arrowhead should a completed triangle . An association relationship should be a solid line if both classes are aware of each other and a line with an open arrowhead if the association is known by only one of the classes.
|
| Figure 3: A complete class diagram, including the class object shown in Figure 2 |
| (click here to enlarge ) |
In Figure 3, we see both the inheritance relationship and two association relationships. The CDSalesReport class inherits from the Report class. A CDSalesReport is associated with one CD, but the CD class doesnt know anything about the CDSalesReport class. The CD and the Band classes both know about each other, and both classes can be associated to one or more of each other.
A class diagram can incorporate many more concepts, which we will cover later in this article series.
Sequence diagram
Sequence
diagrams show a detailed flow for a specific use case or even just part
of a specific use case. They are almost self explanatory; they show the
calls between the different objects in their sequence and can show, at
a detailed level, different calls to different objects.
A sequence diagram has two dimensions: The vertical dimension shows the sequence of messages/calls in the time order that they occur; the horizontal dimension shows the object instances to which the messages are sent.
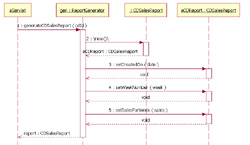
A sequence diagram is very simple to draw. Across the top of your diagram, identify the class instances (objects) by putting each class instance inside a box (see Figure 4). In the box, put the class instance name and class name separated by a space/colon/space : (e.g., myReportGenerator : ReportGenerator). If a class instance sends a message to another class instance, draw a line with an open arrowhead pointing to the receiving class instance; place the name of the message/method above the line. Optionally, for important messages, you can draw a dotted line with an arrowhead pointing back to the originating class instance; label the return value above the dotted line. Personally, I always like to include the return value lines because I find the extra details make it easier to read.
Reading a sequence diagram is very simple. Start at the top left corner with the driver class instance that starts the sequence. Then follow each message down the diagram. Remember: Even though the example sequence diagram in Figure 4 shows a return message for each sent message, this is optional.
|
| Figure 4: A sample sequence diagram |
| (click here to enlarge ) |
By reading our sample sequence diagram in Figure 4, you can see how to create a CD Sales Report. The aServlet object is our example driver. aServlet sends a message to the ReportGenerator class instance named gen. The message is labeled generateCDSalesReport, which means that the ReportGenerator object implements this message handler. On closer inspection, the generateCDSalesReport message label has cdId in parentheses, which means that aServlet is passing a variable named cdId with the message. When gen instance receives a generateCDSalesReport message, it then makes subsequent calls to the CDSalesReport class, and an actual instance of a CDSalesReport called aCDReport gets returned. The gen instance then makes calls to the returned aCDReport instance, passing it parameters on each message call. At the end of the sequence, the gen instance returns aCDReport to its caller aServlet.
Please note: The sequence diagram in Figure 4 is arguably too detailed for a typical sequence diagram. However, I believe it is simple enough to understand, and it shows how nested calls are drawn. Also, with junior developers, sometimes it is necessary to break down sequences to this explicit level to help them understand what they are supposed to do.
Statechart diagram
The
statechart diagram models the different states that a class can be in
and how that class transitions from state to state. It can be argued
that every class has a state, but that every class shouldnt have a
statechart diagram. Only classes with interesting states ?that is,
classes with three or more potential states during system activity
?should be modeled.
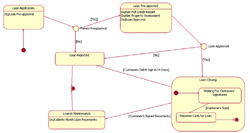
As shown in Figure 5, the notation set of the statechart diagram has five basic elements: the initial starting point, which is drawn using a solid circle; a transition between states, which is drawn using a line with an open arrowhead; a state, which is drawn using a rectangle with rounded corners; a decision point, which is drawn as an open circle; and one or more termination points, which are drawn using a circle with a solid circle inside it. To draw a statechart diagram, begin with a starting point and a transition line pointing to the initial state of the class. Draw the states themselves anywhere on the diagram, and then simply connect them using the state transition lines.
|
| Figure 5: Statechart diagram showing the various states that classes pass through in a functioning system |
| (click here to enlarge ) |
The example statechart diagram in Figure 5 shows some of the potential information they can communicate. For instance, you can tell that loan processing begins in the Loan Application state. When the pre-approval process is done, depending on the outcome, you move to either the Loan Pre-approved state or the Loan Rejected state. This decision, which is made during the transition process, is shown with a decision point ?the empty circle in the transition line. By looking at the example, a person can tell that a loan cannot go from the Loan Pre-Approved state to the Loan in Maintenance state without going through the Loan Closing state. Also, by looking at our example diagram, a person can tell that all loans will end in either the Loan Rejected state or the Loan in Maintenance state.
Activity diagram
Activity
diagrams show the procedural flow of control between two or more class
objects while processing an activity. Activity diagrams can be used to
model higher-level business process at the business unit level, or to
model low-level internal class actions. In my experience, activity
diagrams are best used to model higher-level processes, such as how the
company is currently doing business, or how it would like to do
business. This is because activity diagrams are less technical in
appearance, compared to sequence diagrams, and business-minded people
tend to understand them more quickly.
An activity diagrams notation set is similar to that used in a statechart diagram. Like a statechart diagram, the activity diagram starts with a solid circle connected to the initial activity. The activity is modeled by drawing a rectangle with rounded edges, enclosing the activitys name. Activities can be connected to other activities through transition lines, or to decision points that connect to different activities guarded by conditions of the decision point. Activities that terminate the modeled process are connected to a termination point (just as in a statechart diagram). Optionally, the activities can be grouped into swimlanes, which are used to indicate the object that actually performs the activity, as shown in Figure 6.
 |
| Figure 6: Activity diagram, with two swimlanes to indicate control of activity by two objects: the band manager, and the reporting tool |
In our example activity diagram, we have two swimlanes because we have two objects that control separate activities: a band manager and a reporting tool. The process starts with the band manager electing to view the sales report for one of his bands. The reporting tool then retrieves and displays all the bands that person manages and asks him to choose one. After the band manager selects a band, the reporting tool retrieves the sales information and displays the sales report. The activity diagram shows that displaying the report is the last step in the process.
Component diagram
A
component diagram provides a physical view of the system. Its purpose
is to show the dependencies that the software has on the other software
components (e.g., software libraries) in the system. The diagram can be
shown at a very high level, with just the large-grain components, or it
can be shown at the component package level.2
Modeling a component diagram is best described through an example. Figure 7 shows four components: Reporting Tool, Billboard Service, Servlet 2.2 API, and JDBC API. The arrowed lines from the Reporting Tool component to the Billboard Service, Servlet 2.2 API, and JDBC API components mean that the Reporting Tool is dependent on those three components.
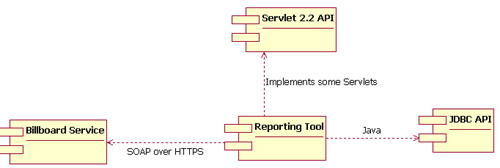 |
| Figure 7: A component diagram shows interdependencies of various software components the system comprises |
Deployment diagram
The
deployment diagram shows how a system will be physically deployed in
the hardware environment. Its purpose is to show where the different
components of the system will physically run and how they will
communicate with each other. Since the diagram models the physical
runtime, a systems production staff will make considerable use of this
diagram.
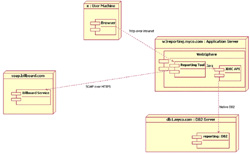
The notation in a deployment diagram includes the notation elements used in a component diagram, with a couple of additions, including the concept of a node. A node represents either a physical machine or a virtual machine node (e.g., a mainframe node). To model a node, simply draw a three-dimensional cube with the name of the node at the top of the cube. Use the naming convention used in sequence diagrams: [instance name] : [instance type] (e.g., w3reporting.myco.com : Application Server).
|
| Figure 8: Deployment diagram. Because the Reporting Tool component is drawn inside of IBM WebSphere, which in turn is drawn inside of the node w3.reporting.myco.com, we know that users will access the Reporting Tool via a browser running on their local machine, and connecting via HTTP over their companys intranet. |
| (click here to enlarge ) |
The deployment diagram in Figure 8 shows that the users access the Reporting Tool by using a browser running on their local machine and connecting via HTTP over their companys intranet to the Reporting Tool. This tool physically runs on the Application Server named w3reporting.myco.com. The diagram shows the Reporting Tool component drawn inside of IBM WebSphere, which in turn is drawn inside of the node w3.reporting.myco.com. The Reporting Tool connects to its reporting database using the java language to IBM DB2s JDBC interface, which then communicates to the actual DB2 database running on the server named db1.myco.com using native DB2 communication. In addition to talking to the reporting database, the Report Tool component communicates via SOAP over HTTPS to the Billboard Service.
Conclusion
Although
this article provides only a brief introduction to Unified Modeling
Language, I encourage you to start applying the information you have
learned here to your own projects and to dig more deeply into UML.
There are several software tools that help you to integrate UML
diagrams into your software development process, but even without
automated tools, you can use markers on a whiteboard or paper and
pencils to draw your UML diagrams and still achieve benefits.
Notes
1
For more information on inheritance and other object-oriented principles, see http://java.sun.com/docs/books/tutorial/java/concepts/inheritance.html
2 The phrase component package level is a programming language-neutral way of referring to class container levels such as .NETs namespaces (e.g., System.Web.UI) or Javas packages (e.g., java.util).
Resources
http://www.uml.org/
?The official UML Web site.
http://www.rational.com/uml/resources/documentation/index.jsp
桹ffers several different versions of the actual UML specification.
http://www-140.ibm.com/developerworks/rational/products/rose
桰nformation on IBM Rational Rose,?/SUP> A commercial UML modeling tool.
http://www-140.ibm.com/developerworks/rational/products/xde
桰nformation on IBM Rational XDE,?/SUP> a commercial UML modeling tool that is integrated with IBMs Eclipse development platform.
http://argouml.tigris.org/
桰nformation on Argo UML, an .open source UML modeling tool built in java.
http://uml.sourceforge.net/index.php
?Information on Umbrello UML Modeller, an open source UML modeling tool for KDE.
Click here to view a PDF version of this article.
Editors Note: This article originally appeared in The Rational Edge .
About the author
Donald
Bell is an IT Specialist in IBM Global Services, where he works with
IBMs customers to design and develop J2EE based software solutions. In
his spare time he attempts to catch up with the yard work at his new
house in Arkansas.


发表评论

相关推荐
一本介绍ASIC流程的英文教材,简介明了,适合初学者以及非IC专业工程师了解数字集成电路的设计生产流程。
Build a core level of ... SQL Primer will guide you from the very basics of SQL through to the mainstream features you need to have a solid, working knowledge of this important, data-oriented language.
Stanton is an easy-to-read, gentle introduction for people with a wide range of backgrounds into the world of data science. Needing no prior coding experience or a deep understanding of statistics, ...
To motivate students and to show that even these basic notions can be extremely useful, the book also aims to provide an introduction to the modern field of network science. Mathematics is often ...
Python Basics: A Self-Teaching Introduction By 作者: H. Bhasin ISBN-10 书号: 1683923537 ISBN-13 书号: 9781683923534 出版日期: 2018-12-17 pages 页数: (604) Python has become the language of choice ...
or an experienced programmer who wants to get up to speed with this language, this gentle introduction also covers aspects of modern PHP, such as internationalization, using PHP from the command line...
Blockchain Basics A Non-Technical Introduction in 25 Steps 英文epub 本资源转载自网络,如有侵权,请联系上传者或csdn删除 本资源转载自网络,如有侵权,请联系上传者或csdn删除
The tool set used to accomplish the task is the free programming language and library of programs called "R." The book explains, in plain language, how to download R to a Windows, Mac, or Linux ...
Penetration Testing Basics: A Quick-Start Guide to Breaking into Systems by Ric Messier English | 15 July 2016 | ISBN: 1484218566 | 132 Pages | PDF (True) | 12.79 MB Penetration testing is the act of...
Blockchain Basics: A Non-Technical Introduction in 25 Steps By 作者: Daniel Drescher ISBN-10 书号: 1484226038 ISBN-13 书号: 9781484226032 Edition 版本: 1st ed. 出版日期: 2017-03-16 pages 页数: (276 ) ...
This short book provides a practical introduction to HTML5. HTML (HyperText Markup Language) is the predominant language of web pages. Originally developed as a way to describe and share scientific ...
Our goal is to give you all the basics you need to understand deep learning, and then show how to use those ideas to construct your own systems. Everything is covered from the ground up, culminating ...
Part I provides an introduction to Android, explaining how it differs from other mobile platforms. You become familiar with the Android SDK and tools, install the development tools, and write and run ...
it begins by leading the programmer gently through the basics of Scheme and continues with an introduction to some of the more advanced features of the language. Many exercises are presented to help ...
Appendices summarize the basics of cosmology and particle physics needed for any quantitative understanding of particle models for dark matter.This interdisciplinary textbook is essential reading for...
This textbook provides an accessible general introduction to the essential topics in computer vision. Classroom-tested programming exercises and review questions are also supplied at the end of each ...
Chapter 19: An Introduction to Django 387 Chapter 20: Web Applications and Web Services 407 Chapter 21: Integrating Java with Python 481 Part IV: Appendices 513 Appendix A: Answers to the Exercises ...
The book is an ideal introduction to this rapidly growing field for graduate students taking courses on wireless communications and for practitioners in the wireless industry. Homework problems and ...
This revised and updated Third Edition of the classic text guides students through assembly language using a hands-on approach, supporting future computing professionals with the basics they need to ...
Our goal is to give you all the basics you need to understand deep learning, and then show how to use those ideas to construct your own systems. Everything is covered from the ground up, culminating ...